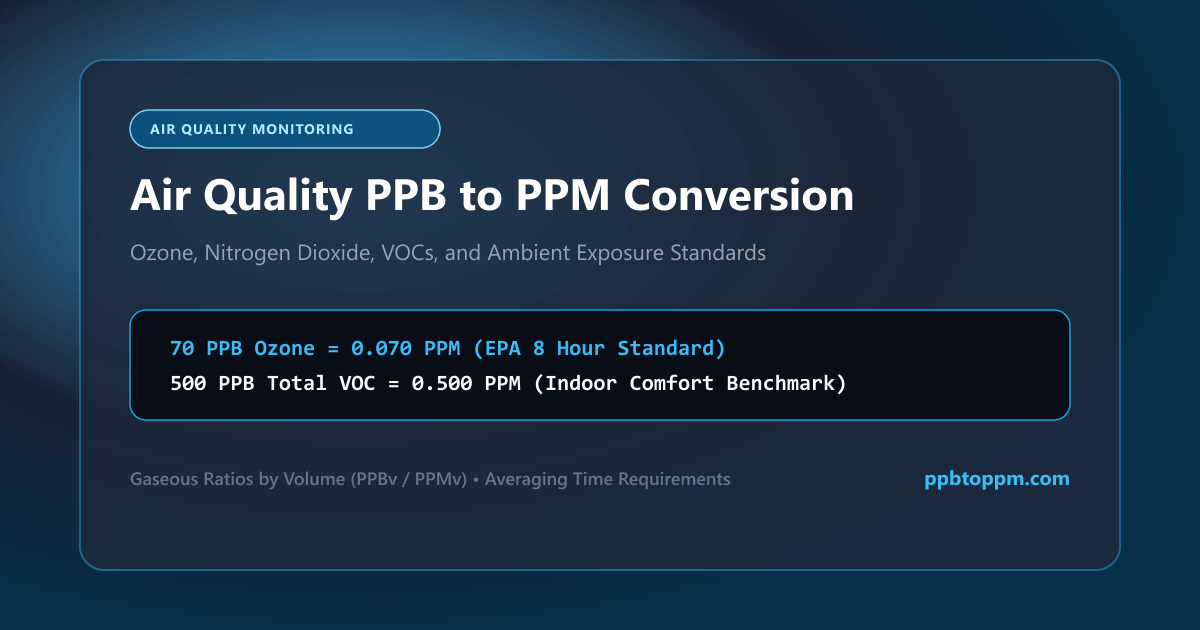
Air-quality monitors report in ppb, regulatory standards often appear in ppm, and comparing the two requires a quick conversion. This guide explains why airborne pollutants favour ppb reporting, walks through the conversion for common gases, and clarifies the distinction between concentration and exposure that trips up many readers.
Why are airborne pollutants commonly expressed in PPB?
Most regulated gases occur at concentrations well below one ppm in ambient air. Ozone, nitrogen dioxide and sulfur dioxide typically register in the tens of ppb, so reporting them in ppm would generate awkward decimals such as 0.045. The atmospheric concentration scale therefore favours ppb for readability.
Instrument design reinforces the convention. Modern air monitoring analysers resolve down to single-digit ppb and sometimes below, matching the unit to the measurement capability. Regulatory frameworks compound this: many ambient air standards are themselves written in ppb, so reporting in the same unit removes a conversion step and the error risk that accompanies it. Where pollutant concentration limits appear in ppm, conversion becomes necessary.
Which air pollutants may be measured in PPB?
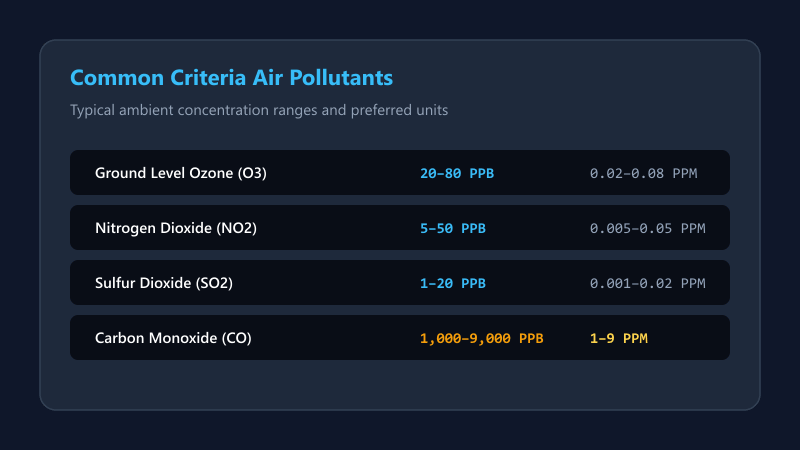
The criteria pollutants dominate ppb reporting. Ozone, nitrogen dioxide, sulfur dioxide and many volatile organic compounds sit comfortably in this range under normal ambient conditions.
| Pollutant | Typical ambient range |
|---|---|
| Ozone | 20–80 ppb |
| Nitrogen dioxide | 5–50 ppb |
| Sulfur dioxide | 1–20 ppb |
| Benzene | 0.5–5 ppb |
Carbon monoxide stands apart, usually appearing in ppm because ambient levels run considerably higher. Indoor environments introduce further gaseous pollutants such as formaldehyde and radon decay products, each with its own conventional unit. Checking which unit a given air-quality report uses before interpreting figures is essential rather than optional.
How can an air-quality PPB reading be converted into PPM?
Divide by 1,000, exactly as with any other ppb figure. An ozone reading of 65 ppb becomes 0.065 ppm; a nitrogen dioxide value of 40 ppb becomes 0.04 ppm.
“The conversion factor does not change with the medium. Air, water, soil — always one thousand.”
One important caveat applies specifically to gases. Parts-per notation for air may be expressed by volume or by mass, and these differ because gas density varies with composition, temperature and pressure. Most atmospheric measurement reports use volume-based ppb, but converting to mass-based units such as micrograms per cubic metre requires molecular weight and ambient conditions. That conversion is entirely separate from ppb to ppm air quality arithmetic.
How are indoor and outdoor air concentrations reported?
Outdoor monitoring follows regulatory frameworks with prescribed averaging periods and units. Outdoor air quality standards typically specify eight-hour or twenty-four-hour averages, so a single instantaneous reading rarely compares directly against a limit.
Indoor air quality assessment operates under looser conventions. Guidance values exist for many compounds, but they vary between jurisdictions and advisory bodies. Indoor readings often come from portable sensors with wider uncertainty than reference-grade equipment, meaning an indoor figure of 30 ppb carries less analytical weight than the same number from a regulatory monitoring station. Treat consumer sensor output as indicative rather than definitive.
How do monitoring instruments display trace pollutants?
Reference-grade analysers usually display in ppb with one decimal place, reflecting their resolution. Portable and consumer devices vary widely, some showing ppm regardless of the magnitude involved.
| Device type | Common display |
|---|---|
| Reference analyser | ppb, 0.1 resolution |
| Portable monitor | ppb or ppm |
| Consumer sensor | ppm, often rounded |
A consumer device reading 0.05 ppm is reporting 50 ppb, which may look reassuringly small until converted. Always identify the displayed unit before drawing conclusions from air sensor readings, particularly when comparing devices from different manufacturers within the same space.
What is the difference between concentration and exposure?
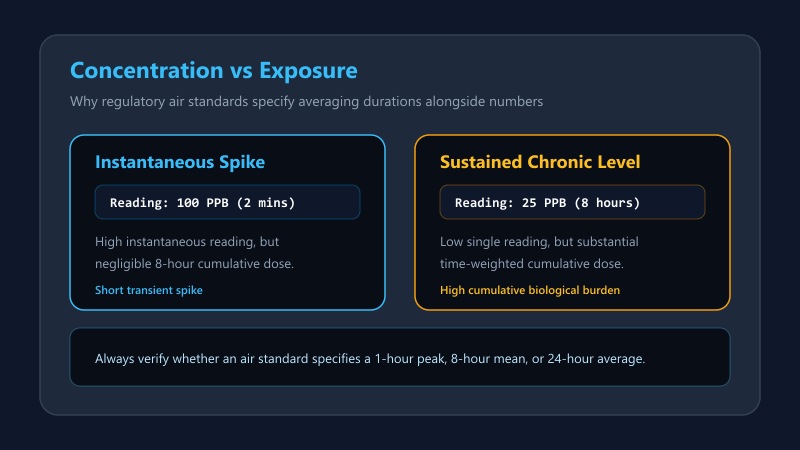
Concentration describes how much of a substance is present in the air at a given moment. Exposure combines that concentration with duration, and it is exposure that determines health relevance.
Ten ppb sustained across a working day represents a different situation from a brief hundred-ppb spike, even though the peak figure looks more alarming. This is precisely why air-quality monitoring standards specify averaging periods alongside limit values. Interpreting a single concentration reading against a limit designed for eight-hour averaging produces misleading conclusions in both directions.
How can converted values be compared across air-quality reports?
Convert every figure to one unit before comparison, and confirm the averaging period matches. Two reports quoting ozone at 70 ppb and 0.05 ppm are not directly comparable if one is a one-hour maximum and the other an eight-hour mean.
| Source | Value | Converted |
|---|---|---|
| Station A | 70 ppb | 0.07 ppm |
| Station B | 0.05 ppm | 50 ppb |
Record the original unit alongside the converted value in any summary table. This preserves traceability back to source documents, which matters if a figure is later questioned during review of atmospheric data.
Why should unit labels remain attached to converted measurements?
A bare number in an air-quality context is genuinely dangerous. The figure 0.08 could represent ppm, ppb or milligrams per cubic metre, and the three differ by orders of magnitude.
Attach the unit directly to every value, on every line, in every table. Column headings alone prove insufficient once data is copied into another document or a presentation slide. For pollutant measurement units, many organisations mandate repeating the unit with each figure precisely because header-only labelling fails so reliably during data transfer.
What limitations should be considered when interpreting air measurements?
Single readings capture one location at one moment. Air composition varies substantially with height, distance from sources, wind direction and time of day, so spatial representativeness matters as much as analytical accuracy.
Sensor calibration drift affects lower-cost equipment considerably over weeks or months. Cross-sensitivity is another common limitation, where a device responds to compounds other than its target gas. Interpretation of air pollution data against health guidance should involve qualified professionals and reference-grade data rather than resting on consumer sensor output alone.
Case Study: The Office Sensor Alarm
A facilities manager installed consumer air-quality sensors across an office floor. One unit reported volatile organic compounds at 0.6 ppm, which the manufacturer’s app flagged in red. Converted, that equalled 600 ppb. A follow-up survey using calibrated equipment measured 85 ppb in the same location, with the discrepancy traced to sensor cross-sensitivity to a cleaning product used nearby. The building was never unsafe, but the false alarm triggered two days of disruption and an unnecessary contractor visit.
Conclusion
You can now handle any air pollution ppb to ppm conversion confidently. Divide by 1,000, then confirm the averaging period before comparing against any standard.
Keep unit labels attached and treat consumer sensor readings as indicative. For decisions affecting health or regulatory compliance, rely on reference-grade air monitoring data and qualified interpretation.