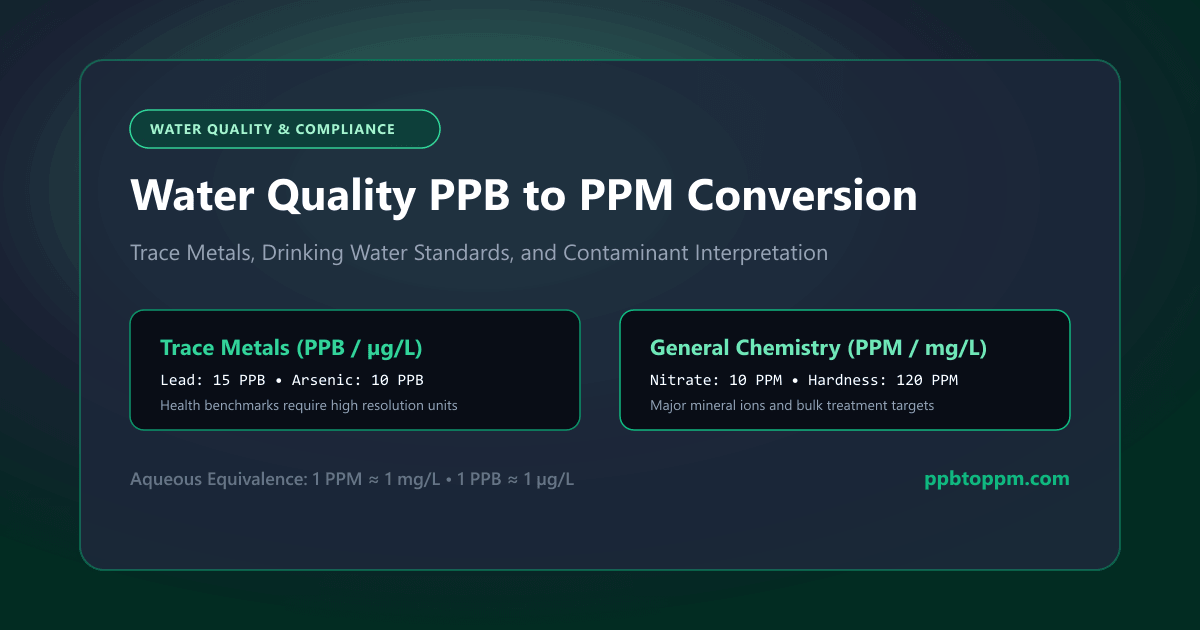
Water-quality certificates mix units freely. Metals arrive in ppb, hardness in ppm, and comparing them against regulatory limits demands conversion. This guide explains why water testing favours ppb for certain analytes, how to convert results reliably, and how unit errors distort the interpretation of contaminant levels.
Why are PPB measurements common in water testing?
Many regulated substances cause concern at concentrations well below one ppm. Heavy metals, pesticides and certain industrial compounds have limits measured in single or double-digit ppb, so reporting them in ppm would produce strings of leading zeros that invite error.
Instrument capability reinforces the choice. Techniques such as inductively coupled plasma mass spectrometry detect dissolved metals far into the ppb range, and increasingly into ppt for some analytes. Reporting at the unit that matches instrument resolution keeps figures meaningful. This is why water laboratory testing reports for trace metals almost universally use ppb while general chemistry parameters stay in ppm.
How are contaminants reported in drinking water?
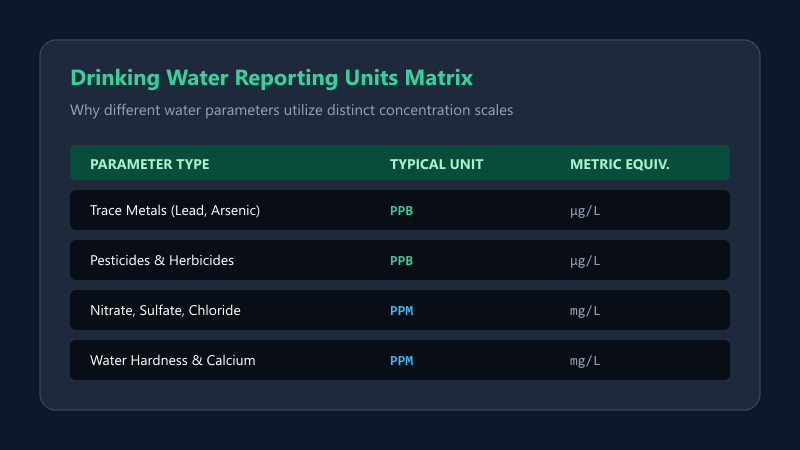
Most drinking water testing reports group analytes by category, each with its conventional unit. Trace metals and organic compounds appear in ppb or micrograms per litre; major ions, hardness and chlorine residual appear in ppm or milligrams per litre.
| Parameter type | Typical unit |
|---|---|
| Trace metals | ppb / µg/L |
| Pesticides | ppb / µg/L |
| Nitrate, chloride | ppm / mg/L |
| Hardness | ppm / mg/L |
Alongside each result, reports normally state the applicable regulatory limit in the same unit, which removes the need for conversion in routine review. Problems arise when comparing across laboratories or against limits published elsewhere, since water-quality standards documents do not always match the reporting convention of the testing laboratory.
How can a water-test PPB result be converted into PPM?
Divide the ppb figure by 1,000, or shift the decimal three places left. A lead result of 12 ppb becomes 0.012 ppm; a nitrate figure of 4,500 ppb becomes 4.5 ppm.
In dilute aqueous samples, a useful equivalence simplifies matters further. One ppm corresponds closely to one milligram per litre, and one ppb to one microgram per litre, because a litre of water weighs approximately one million milligrams. Most environmental water testing reports therefore treat ppb and µg/L as interchangeable. Strictly this holds only for dilute solutions near standard density, but for drinking water the approximation is entirely adequate.
How do trace metals appear in water-quality reports?
Trace metals including lead, arsenic, cadmium and mercury are almost always listed in ppb. Their health-based limits sit low enough that ppm reporting would obscure meaningful variation between samples.
“In metals analysis, ppb is the working language.”
Copper and zinc occupy a middle ground. Their limits fall nearer the ppm range, so laboratories may report them either way depending on house convention. When compiling a multi-analyte summary, converting everything to a single unit before comparison prevents the ranking errors that arise from mixed scales. This step matters particularly in water sample analysis across multiple sampling points.
How are chemical pollutants measured in water?
Organic chemical contaminants such as solvents, pesticides and disinfection by-products are typically quantified by chromatographic methods and reported in ppb. Detection limits for these compounds often fall below one ppb, so the unit suits both the instrumentation and the regulatory framework.
Sample handling influences the result as much as the analysis does. Volatile compounds escape from improperly sealed containers, and some analytes degrade without preservation or refrigeration. A perfectly executed chemical testing procedure cannot rescue a compromised sample, so concentration in water figures should always be read alongside the collection and holding-time information on the certificate.
How should converted values be interpreted?
Convert the regulatory limit as well as the result, then compare like with like. A lead result of 12 ppb sits below a limit of 0.015 ppm only once you recognise that limit as 15 ppb.
Context beyond the single number matters considerably. Detection limits, sampling location and date all shape what a figure means. A result just above a threshold may warrant resampling rather than immediate action, depending on the applicable framework. Interpretation of water test results against regulatory requirements should involve the relevant authority or a qualified professional, since the consequences of misreading a contaminant threshold can be significant.
How can multiple contaminants be compared after conversion?
Build a single table with every analyte expressed in one unit. Mixed units make relative magnitudes invisible, because 40 ppb and 0.3 ppm look similar on the page while differing by a factor of more than seven.
| Analyte | Result (ppb) |
|---|---|
| Lead | 8 |
| Arsenic | 3 |
| Copper | 420 |
| Nitrate | 4,200 |
Presented this way, the relative scale becomes immediately apparent. Note that ranking by concentration alone says nothing about relative hazard, since each substance carries its own limit. Comparing each result against its own threshold, expressed as a percentage of that limit, gives a far more useful picture for environmental monitoring purposes.
What role does concentration play in water-quality analysis?
Concentration determines regulatory compliance, treatment requirements and monitoring frequency. It is the primary quantitative output of laboratory water analysis and drives nearly every downstream decision.
Trends carry more information than single values. A steadily rising contaminant concentration across several sampling rounds signals a developing issue even while every individual result remains compliant. This is why monitoring programmes emphasise consistent methodology and consistent units: without both, trend analysis becomes unreliable and genuine changes hide within apparent noise.
How can conversion errors affect test-result interpretation?
A thousandfold error transforms a routine result into an apparent emergency, or conversely masks a genuine exceedance. Reading 0.012 ppm as 12 ppm suggests lead at a thousand times the regulatory limit.
Such errors trigger real consequences: unnecessary public notifications, emergency treatment measures and substantial cost. The reverse error is more dangerous still, since an exceedance reported as compliant may go unaddressed for months. Given that the conversion itself takes seconds, building in a verification step before any water-quality report is issued represents an exceptionally cheap safeguard.
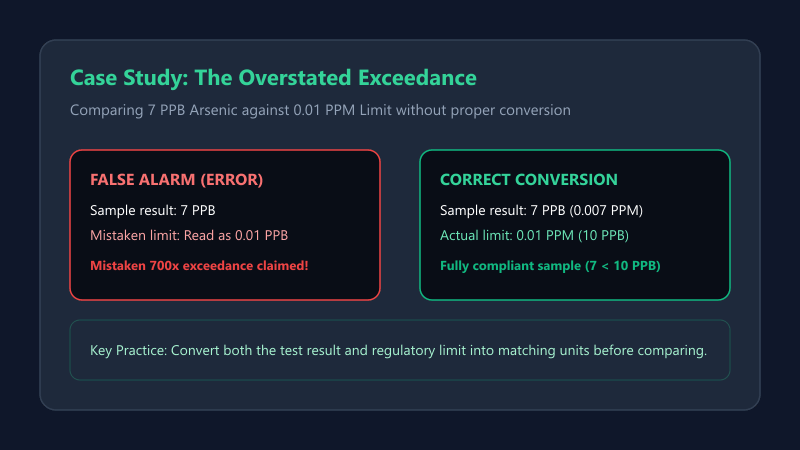
Case Study: The Overstated Exceedance
A small utility received arsenic results at 7 ppb from its contract laboratory. A newly appointed analyst, comparing against a limit published as 0.01 ppm, read the limit as 0.01 ppb and concluded the sample exceeded the threshold by seven hundred times. Draft notification letters were prepared before a senior colleague converted the limit correctly to 10 ppb. The sample was comfortably compliant. The near-miss prompted the utility to adopt a policy of expressing every result and every limit in ppb throughout all documentation.
Conclusion
You can now convert any water contaminant ppb to ppm result reliably. Divide by 1,000, convert the applicable limit to matching units, then compare.
Keep units consistent across every result, limit and trend chart. For compliance decisions, confirm interpretation with your regulator or a qualified water-quality professional rather than relying on the arithmetic alone.