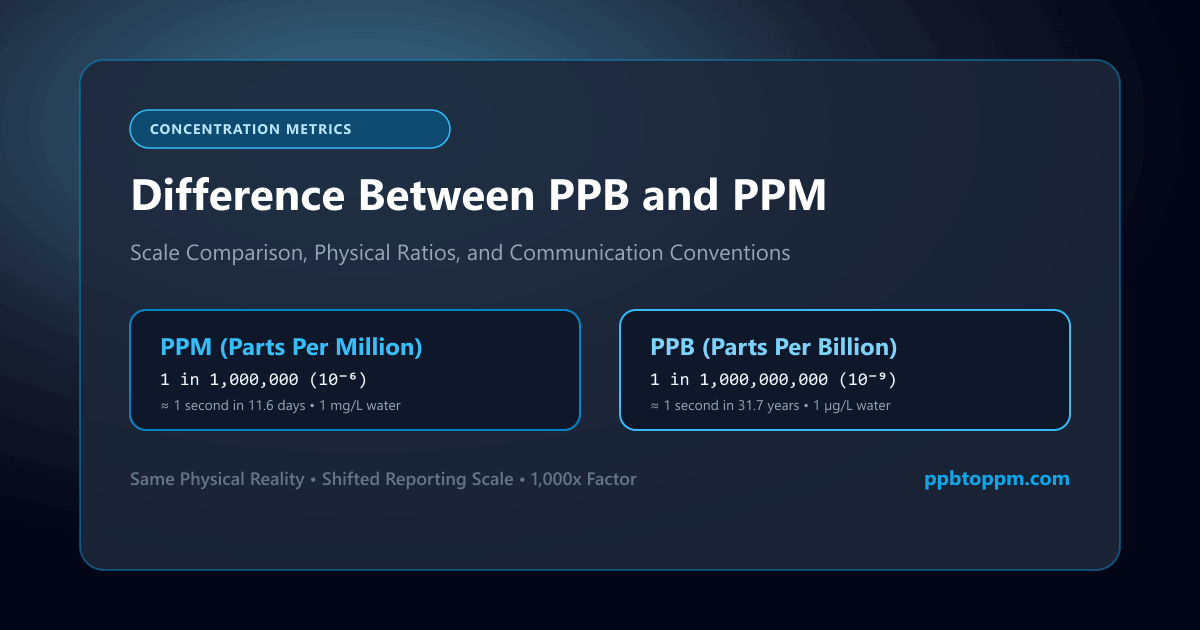
Both units describe the same idea: how much of one substance sits inside a larger whole. Yet ppb vs ppm confusion causes real problems in laboratory reports and regulatory filings. This guide explains what “parts per” actually means, compares the two scales visually, and shows when each concentration unit communicates most clearly.
What does “parts per” mean?
The phrase describes a dimensionless ratio. You count how many units of a substance appear within a fixed number of units of the total mixture, then report that count. Because both numerator and denominator share the same dimension, the result carries no physical units at all, which is why parts per notation transfers cleanly between mass, volume and mole-based measurements.
This dimensionless quality gives the notation considerable flexibility. A chemical measurement unit expressed this way works equally well for a solid alloy, a liquid solution or an atmospheric gas. It also sidesteps the need to specify grams, litres or moles in casual discussion. The trade-off is ambiguity: a careful report should always state whether the ratio is by mass, by volume or by mole, since these can differ substantially for gases.
How large is one part per million?
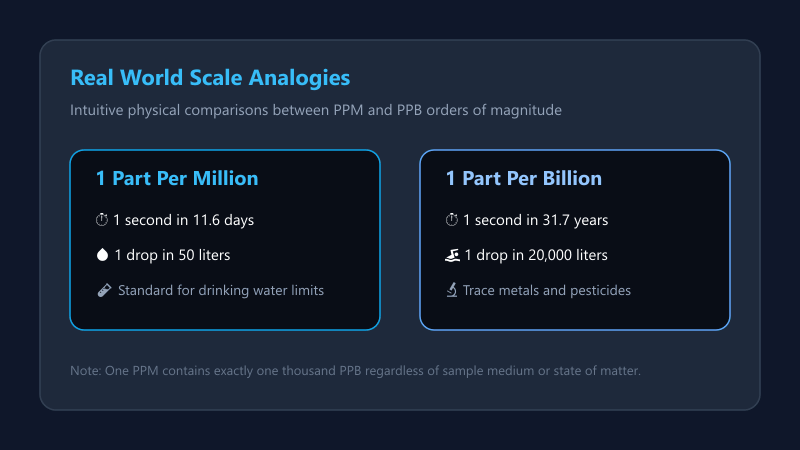
One ppm represents one unit within one million, equivalent to 0.0001 percent. The comparison most people find useful is a single second within roughly eleven and a half days, or one milligram dissolved in one litre of water.
“One ppm is one drop of water in fifty litres.”
In practical terms, parts per million meaning covers the range where regulators set most drinking-water limits, agricultural residue thresholds and workplace exposure guidelines. Fluoride in treated water, chlorine residual and dissolved oxygen all sit comfortably in ppm territory. The numbers stay readable, typically between 0.1 and a few hundred, which suits laboratory units and public communication alike.
How small is one part per billion?
One ppb is one thousand times smaller again: a single unit within one billion. That equates to one second in roughly thirty-two years, or one microgram per litre in dilute aqueous solution.
| Unit | Equivalent |
|---|---|
| 1 ppm | 1 second in 11.6 days |
| 1 ppb | 1 second in 32 years |
The parts per billion meaning becomes relevant for substances that cause harm at extremely low doses. Lead, mercury, certain pesticides and many volatile organic compounds have regulatory limits below one ppm, making ppb the natural reporting choice. Modern analytical instruments detect well into this range routinely, so trace quantities that were invisible thirty years ago now appear on standard reports.
Why is PPB used for smaller concentrations?
Readability drives the choice. Writing 0.0004 ppm demands careful counting of zeros, and a single misplaced digit changes the meaning by a factor of ten. Expressing the same figure as 0.4 ppb removes that risk entirely while communicating identical information.
The measurement sensitivity of modern instrumentation reinforces the trend. Mass spectrometers and inductively coupled plasma systems detect concentrations far below the ppm threshold, so reporting everything in ppm would generate long strings of leading zeros. Choosing a unit that keeps figures between roughly 0.1 and 1,000 is a widely followed convention in analytical units practice, and ppb serves that purpose for trace levels.
How do PPB and PPM represent the same substance?
The substance and its actual quantity never change. Only the reporting scale shifts, exactly as a distance can be stated in metres or kilometres without moving anything. A sample containing 250 ppb of nitrate contains 0.25 ppm of nitrate, and these are two descriptions of one physical reality.
This equivalence matters when comparing documents from different sources. One laboratory may default to ppb for all trace metals while another uses ppm throughout. Converting everything to a single unit before comparison prevents false conclusions. Failing to do so produces exactly the kind of concentration interpretation error that leads to unnecessary resampling or, worse, overlooked exceedances.
How does the numerical scale change between the two units?
Moving from ppb to ppm divides the figure by 1,000; moving the other way multiplies by 1,000. The decimal point shifts three places in the corresponding direction, and nothing else changes.
| PPB | PPM |
|---|---|
| 1 | 0.001 |
| 50 | 0.05 |
| 500 | 0.5 |
| 5,000 | 5 |
The concentration magnitude relationship is worth internalising because it recurs constantly. Notice how a value that looks substantial in ppb becomes modest in ppm, and vice versa. This psychological effect influences how readers perceive risk, which is one reason regulatory documents specify their required unit explicitly rather than leaving the choice open.
Which concentration unit is more precise for trace substances?
Neither unit is inherently more precise. Precision depends on the instrument and method, not on the reporting scale. A measurement accurate to within ten percent remains equally accurate whether you express it as 400 ppb or 0.4 ppm.
What does differ is practical readability, and that affects transcription accuracy. Reporting small concentrations in ppb reduces the chance of a dropped zero when data moves between spreadsheets, reports and databases. For this reason many laboratories adopt a house rule: report in whichever unit keeps the significant figures ahead of the decimal point. It is a convention about concentration notation, not about measurement sensitivity.
How should PPB and PPM appear on laboratory reports?
Every numerical result needs its unit attached directly, never in a distant column heading or footnote. A figure of 12 means nothing on its own; 12 ppb is unambiguous. Good laboratory reporting units practice repeats the unit on each line rather than assuming the reader tracks a header.
Consistency within a single document matters just as much. Mixing ppb for some analytes and ppm for others within one table forces readers to convert mentally, and mental conversion under time pressure produces errors. Where regulatory limits are quoted alongside results, both should appear in matching units. Many environmental concentration report templates now enforce this automatically.
What happens when a concentration crosses between PPB and PPM?
Around the 1,000 ppb threshold, either unit produces a comfortable number. A result of 1,200 ppb reads equally well as 1.2 ppm, and laboratories differ on which they prefer. Some switch units above 1,000 ppb; others maintain one unit throughout a report series for consistency.
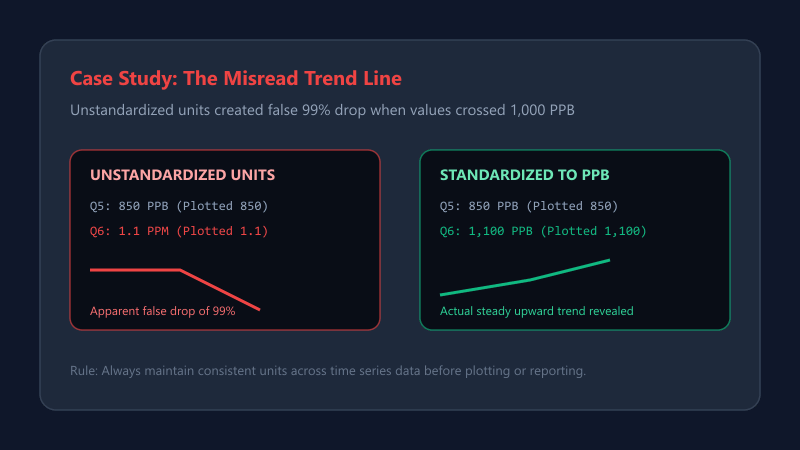
The risk appears in trend data. If a monitoring programme reports 850 ppb one quarter and 1.1 ppm the next, a casual reader might see a decrease where an increase occurred. For concentration reporting across time series, holding the unit constant is far safer than optimising each individual figure for readability. Convert for presentation only at the final step.
Case Study: The Misread Trend Line
A municipal water authority tracked manganese across eight quarters. The laboratory reported the first five results in ppb and the final three in ppm, switching once values exceeded 1,000 ppb. A summary chart plotted the raw numbers without conversion, producing an apparent ninety-nine percent drop between quarter five and quarter six. The error survived two internal reviews before a technician noticed the unit column. Standardising all eight figures to ppb revealed a steady upward trend that had been entirely obscured.
Conclusion
You now understand the difference between ppb and ppm clearly. One ppm equals one thousand ppb, and the choice between them is about readability rather than accuracy.
Attach units to every figure and keep them consistent within any document or time series. That single habit prevents the majority of concentration comparison errors in technical reporting.