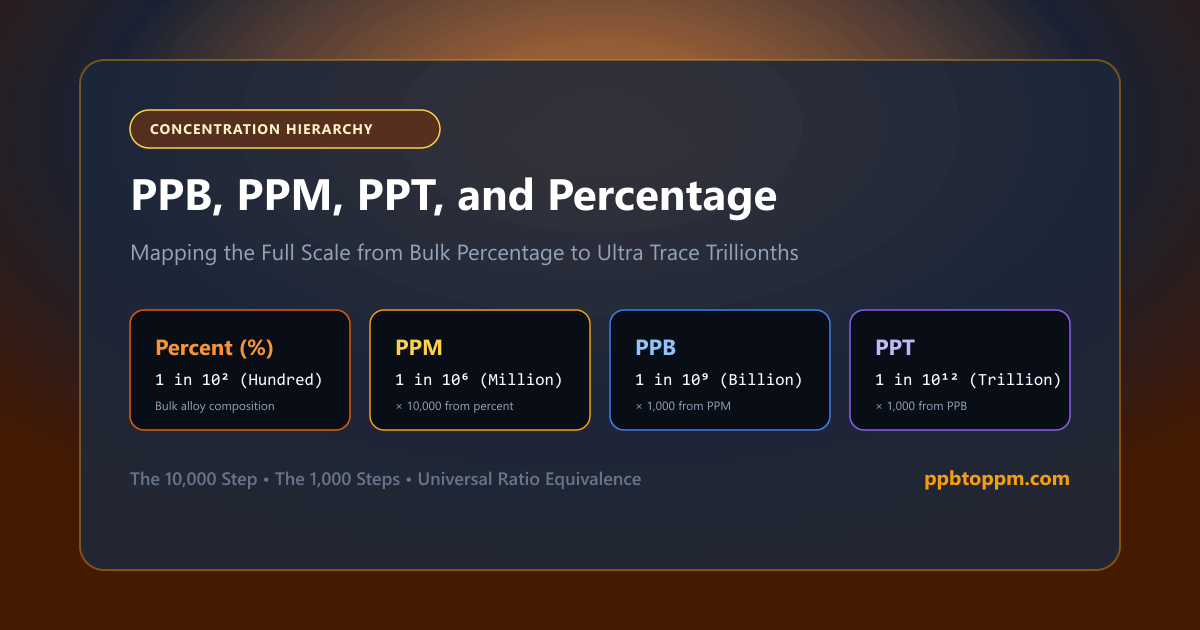
Four notations, one underlying idea. PPB PPM PPT percent comparisons confuse readers because each unit sits a thousandfold apart, except percentage, which follows a different base entirely. This guide maps the full hierarchy and shows how to move between any two concentration units reliably.
What does PPB represent compared with PPM?
PPB means one part in 10⁹, while PPM means one part in 10⁶. The gap between them is exactly one thousand, so one ppm contains one thousand ppb.
Both belong to the same parts-per notation family and share its dimensionless character. The only distinction is scale, chosen to keep reported figures readable. Understanding this relationship first makes the remaining units straightforward, since parts per trillion extends the same pattern one step further down.
What does PPT mean in concentration measurement?
PPT stands for parts per trillion, one part in 10¹². It sits one thousand times below ppb, continuing the established pattern.
| Unit | Parts per |
|---|---|
| ppm | 10⁶ |
| ppb | 10⁹ |
| ppt | 10¹² |
One ppt represents roughly one second in thirty-two thousand years. Instruments capable of reliable ultra-trace quantity detection at this level remain specialised and expensive, which is why ppt appears mainly in semiconductor process control, certain persistent-pollutant studies and high-purity materials testing.
How does percentage concentration differ from parts-per units?
Percentage concentration means parts per hundred, so one percent equals one part in 10². It occupies the same conceptual family but sits far higher on the scale.
“Percent is simply parts per hundred. The family is larger than most people realise.”
Because one percent equals 10,000 ppm, the two rarely appear in the same context. Percentage suits bulk composition such as alloy content or solution strength; parts-per units suit trace analysis. Mixing them within one table forces readers across four orders of magnitude, which is where errors originate.
How are PPB, PPM, PPT, and percent mathematically related?
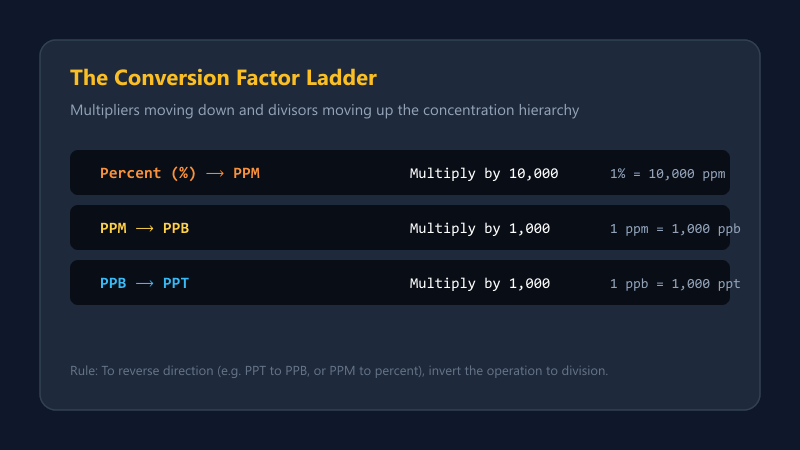
Each step down the hierarchy divides by one thousand, except the jump from percent to ppm, which divides by 10,000.
| From | To | Operation |
|---|---|---|
| percent | ppm | × 10,000 |
| ppm | ppb | × 1,000 |
| ppb | ppt | × 1,000 |
Reverse each operation to move upward. This concentration hierarchy covers every routine conversion in trace analysis, and memorising the two factors — ten thousand and one thousand — handles all of them without reference material.
Which unit represents the smallest relative quantity?
Among these four, ppt describes the smallest relative concentration. Percent describes the largest, with ppm and ppb between them.
Ordered from largest to smallest: percent, ppm, ppb, ppt. Each step represents a substantial reduction, and confusing adjacent units introduces thousandfold errors while confusing percent with ppb introduces errors of ten million. Keeping the concentration magnitude ordering firmly in mind is the single best defence against such mistakes.
How can one concentration be expressed using different units?
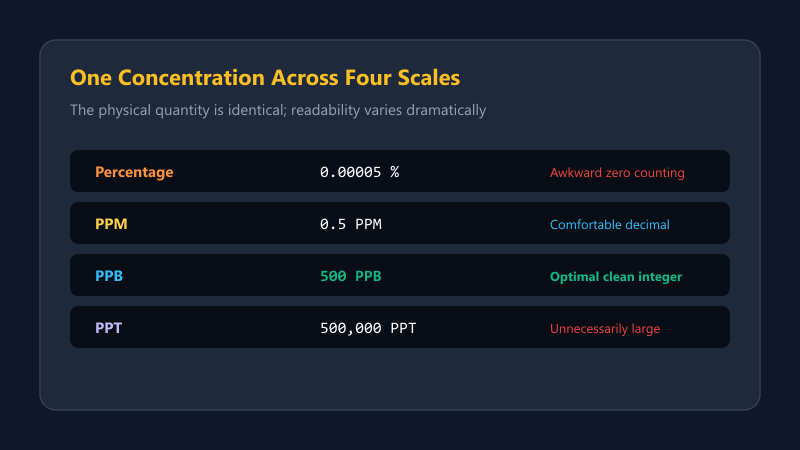
A single physical concentration converts freely across all four notations without changing anything about the sample.
| Unit | Value |
|---|---|
| percent | 0.00005 % |
| ppm | 0.5 ppm |
| ppb | 500 ppb |
| ppt | 500,000 ppt |
All four rows describe an identical concentration. Notice how dramatically readability varies: 500 ppb reads cleanly, while the percent and ppt expressions demand careful attention. This illustrates why unit equivalence awareness matters more than any single preferred format.
Why do scientific reports use different concentration scales?
Different fields settled on different conventions based on their typical working ranges. Environmental chemistry gravitated to ppb and ppt; materials science and pharmacy to percent and ppm.
Regulatory frameworks lock these choices in place. Once a standard is written in a particular unit, laboratories report in that unit to enable direct comparison. The result is a landscape where laboratory reporting units vary legitimately between sectors, and cross-sector comparison requires deliberate conversion rather than assumption.
How can you avoid mixing percentage and parts-per units?
Standardise on one notation per document and convert everything before compiling. Never place percent and ppb in adjacent columns of the same table without a conversion column.
Where both must appear, separate them visually and label each explicitly. Some organisations prohibit mixed units in a single table outright, requiring a converted column instead. Given the ten-million factor between percent and ppb, this unit consistency discipline is proportionate to the risk involved.
When is each concentration format most useful?
Match the unit to the magnitude, keeping figures readable without excessive zeros.
| Range | Best unit |
|---|---|
| Above 1 % | percent |
| 1 ppm – 1 % | ppm |
| 1 ppb – 1 ppm | ppb |
| Below 1 ppb | ppt |
Regulatory requirements override this guidance whenever they specify a unit. Where no requirement applies, the readability rule produces the clearest concentration reporting format for most audiences.
Case Study: The Specification Mismatch
A materials supplier quoted trace iron content in a high-purity reagent as 0.00002 percent. The purchasing laboratory’s specification required below 100 ppb. Nobody converted, and the order was rejected as non-compliant. In fact 0.00002 percent equals 0.2 ppm, or 200 ppb — genuinely above the specification, but by a factor of two rather than the thousandfold discrepancy initially assumed. The confusion delayed procurement by five weeks while both parties disputed figures that neither had converted.
Conclusion
You now understand how ppb vs ppm vs ppt and percentage relate across the full concentration scale. Each parts-per step differs by one thousand; percent to ppm differs by ten thousand.
Standardise units before any comparison and state conversions explicitly. A concentration conversion chart on the wall prevents the cross-scale errors that cause the most expensive misunderstandings.