Both units express the same physical reality, so choosing between them is a communication decision rather than a technical one. This guide explains when PPB usage produces clearer results, when PPM usage serves better, and how laboratories formalise unit selection to keep reports consistent and readable.
Why are very small concentrations difficult to express in PPM?
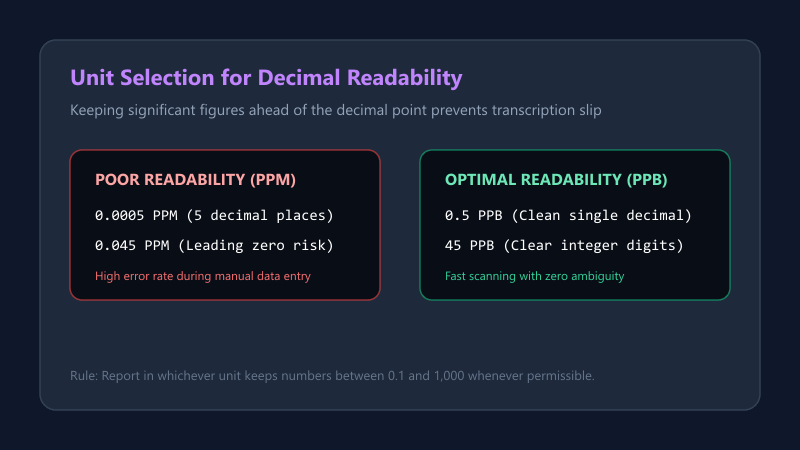
Below roughly 0.1 ppm, figures accumulate leading zeros that readers must count carefully. A value of 0.00035 ppm requires attention to five decimal places, and a single dropped zero changes the meaning tenfold.
The risk multiplies during data transfer. Each time a figure moves between a spreadsheet, a report and a database, transcription error becomes possible. Expressing the same low concentration as 0.35 ppb eliminates the problem entirely while conveying identical information. This is why trace measurement work migrated toward ppb as instrument capability improved through the late twentieth century.
When does PPB provide a more practical numerical value?
The working guideline most laboratories follow keeps significant figures ahead of the decimal point where possible. Values between roughly 0.1 and 1,000 read most reliably.
| Concentration | Better unit |
|---|---|
| 0.0005 ppm | 0.5 ppb |
| 0.045 ppm | 45 ppb |
| 2.5 ppm | 2.5 ppm |
| 450 ppm | 450 ppm |
Applying this rule produces trace concentration figures that people read correctly at a glance. It also reduces the cognitive load during review, since a scanner checking fifty results does not need to count decimal places on each one. The convention costs nothing and prevents a measurable proportion of errors.
How does the size of a concentration affect unit selection?
The underlying principle mirrors everyday distance measurement. Nobody states a journey in millimetres or a pencil length in kilometres, because the resulting numbers become unwieldy in opposite directions.
“Choose the unit that keeps the number comfortable to say out loud.”
Applied to measurement scale decisions, this means ppm for concentrations above about one ppm, ppb between one ppb and one ppm, and ppt below that. The thresholds are conventions rather than rules, and some fields maintain a single unit throughout regardless. Consistency within a document usually outranks optimising each individual concentration notation.
Which industries commonly report trace concentrations?
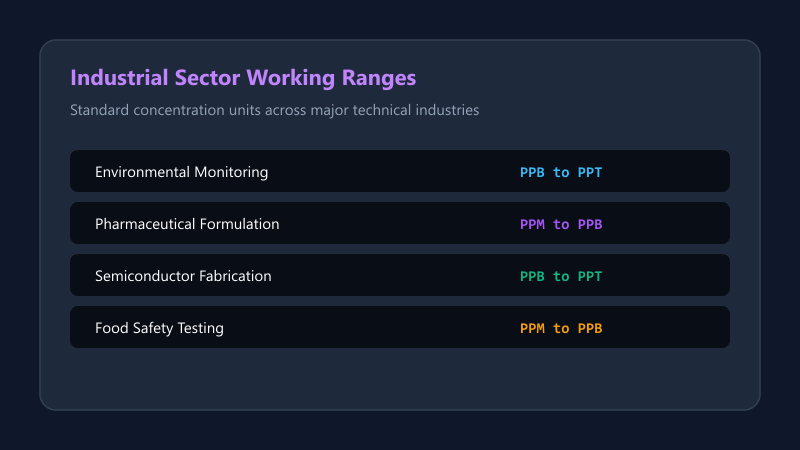
Several sectors work routinely in the ppb range and below. Environmental monitoring leads, followed by pharmaceutical manufacturing, semiconductor production and food safety testing.
| Sector | Typical range |
|---|---|
| Environmental | ppb to ppt |
| Pharmaceutical | ppm to ppb |
| Semiconductor | ppb to ppt |
| Food safety | ppm to ppb |
Semiconductor fabrication pushes furthest, where low-level contaminant specifications for process water and gases extend into ppt territory. Each sector develops its own analytical reporting conventions, which is why a figure formatted one way in an environmental report may appear differently in a pharmaceutical certificate of analysis.
How do laboratories choose an appropriate concentration unit?
Most laboratories document unit choice in their standard operating procedures rather than leaving it to individual analysts. The method documentation specifies the reporting unit alongside detection and quantification limits.
This formalisation serves quality-assurance purposes directly. If every analyst chose independently, results from the same laboratory would appear in mixed units across a single report series, undermining trend analysis. Accreditation schemes generally expect documented laboratory reporting conventions, and auditors check adherence during assessment visits.
When should a result be reported in PPB?
Report in ppb when the result falls below one ppm, when the applicable regulatory limit is expressed in ppb, or when the client or programme specifies it.
The regulatory alignment point deserves emphasis. If a drinking-water standard for a metal is written as 10 ppb, reporting the result as 0.008 ppm forces every reader to convert before assessing compliance. Matching the environmental reporting unit to the applicable standard removes that step and the errors it invites. Where a limit is published in ppm, the reverse logic applies.
When is PPM easier to understand?
Above one ppm, the ppm expression produces cleaner figures and aligns with most general-audience communication. Public-facing water-quality summaries, fertiliser labelling and workplace exposure guidance typically use ppm.
Familiarity matters for non-specialist readers. Many people have encountered ppm in contexts such as pool chemistry or water hardness, while ppb remains unfamiliar outside technical work. When writing for a mixed audience, ppm with a parenthetical ppb equivalent often communicates best, keeping concentration precision intact without sacrificing accessibility.
How can scientists avoid confusing concentration scales?
Three practices prevent most confusion. First, attach units to every figure rather than relying on column headers. Second, maintain one unit throughout any single document or time series. Third, state both expressions where ambiguity might arise.
| Practice | Benefit |
|---|---|
| Unit on every value | Survives copy-paste |
| One unit per document | Enables comparison |
| Both units shown | Removes ambiguity |
Writing “0.5 ppm (500 ppb)” costs eleven characters and eliminates any question. For scientific communication across audiences with differing familiarity, that trade is almost always worthwhile.
How should unit conversions be documented in technical reports?
Record the original unit, the converted value and the conversion factor applied. A brief note such as “values converted from ppm to ppb by multiplying by 1,000” preserves traceability to the source.
This documentation matters during review and audit. An undocumented conversion looks identical to a transcription error when someone examines the file months later. Where a report compiles data from multiple laboratories, a unit consistency statement in the methods section explains the standardisation applied and lets readers trace any figure back to its original analytical report.
Case Study: The Mixed-Unit Database
A consultancy maintained a contaminated-land database populated from fifteen years of laboratory reports. Early records used ppm throughout; later ones used ppb for metals. No conversion field existed, and no documentation flagged the change. A trend analysis produced apparent thousandfold increases at multiple sites around the transition year. Rebuilding the database with a mandatory unit field and standardised storage in ppb took four months, and the exercise revealed that three earlier assessments had reached incorrect conclusions.
Conclusion
You now know when to use ppb and when ppm serves better. Keep figures between roughly 0.1 and 1,000, match the applicable regulatory unit, and stay consistent within any document.
Document every conversion you perform. A laboratory unit conversion that nobody recorded is indistinguishable from an error when the file is reviewed years later.